30 Days MyDFIR Challenge DAYS 1-15
30 days Challenge made by MyDFIR channel.
Sebastian
11/28/202416 min read
I’m always looking for ways to gain as much hands-on experience as possible. While browsing YouTube for projects to upload to my blog, I came across a great challenge by MyDFIR, a YouTuber I frequently watch for ideas on homelabs, projects, and certifications.
The challenge? A 30-day project to build a cloud-based lab and gain practical experience as a SOC Analyst—exactly what I was looking for!
I’ll try to make these posts as detailed as possible. It’s going to be a lot of work, but I’m sure I’ll learn tons and have fun along the way.
Full Credits to Steven from MyDFIR Youtube channel, And shout out for this guide on 30 day SOC lab.
Let’s get started!
DAY 1
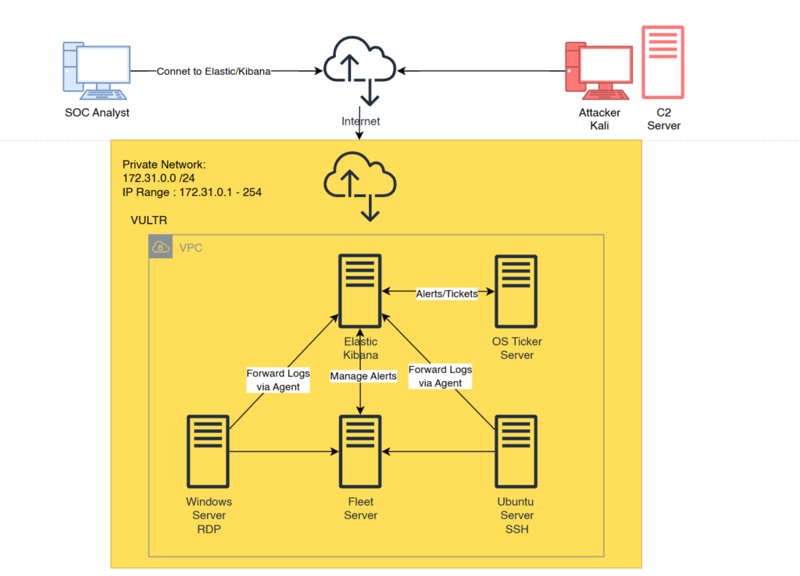
The first day of the challenge focuses on planning. Our task is to create a diagram of the lab we’ll build in the next 30 days. Using a web-based diagramming tool, I outlined the entire setup.
Here’s what we’ll be building, hosted primarily on VULTR Cloud:
Elastic / Kibana Server
Fleet Server
Ubuntu Server with SSH enabled
Windows Server with RDP enabled
OS Ticket Server
Command and Control (C2) Server
Outside the cloud, I’ll be setting up two additional VMs:
Kali Linux (Attacker)
SOC Machine (for monitoring and analysis)
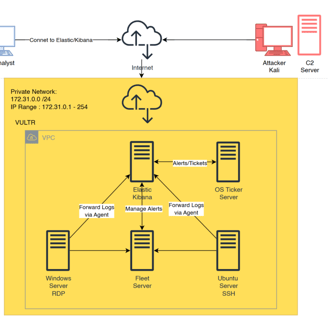
And here’s the final diagram of our lab:
DAY 2
30-Day SOC Analyst Lab Challenge: Day 2
Today, we explored the ELK Stack, the foundation for our lab's data processing and analysis. Each component brings unique features that make monitoring and managing logs much more efficient. Let’s break them down!
Elasticsearch:
This is the database layer of the ELK Stack. Its primary purpose is to store, manage, and make our logs searchable.
Elasticsearch uses its own query language called ES|QL for searching through the data.
Logstash:
Logstash is a server-side data processing pipeline that ingests, filters, and transforms data from various sources.
Popular Ways to Collect Telemetry
Beats (lightweight data shippers):
Filebeat: For log files.
Metricbeat: For metrics.
Packetbeat: For network data.
Winlogbeat: For Windows events.
Auditbeat: For audit data.
Heartbeat: For uptime monitoring.
Elastic Agents:
These can collect multiple types of data simultaneously, simplifying deployments.
In this lab, we’ll use Elastic Agents to ingest data from various sources. Additionally, Logstash helps filter logs to meet specific criteria, ensuring we only store what’s needed. This approach saves both time and storage costs.
Kibana:
Kibana is the visualization layer of the stack. It allows us to:
Set up alerts, monitor metrics, and much more.
Build dashboards.
Query and analyze data.
Implement machine learning.
That’s it for today! Day 2 was all about familiarizing ourselves with the tools we’ll use throughout this challenge. I’m already excited about diving deeper into the ELK Stack.
DAY 3
Today, we’re getting hands-on and diving into building our ELK Stack! This is where the challenge gets exciting. We’ll start by setting up the infrastructure needed to run our lab on VULTR.
The first step was creating an account on VULTR. It’s a cloud platform that lets us build and manage virtual machines, networks, and other cloud resources. After signing up and logging in, I accessed the dashboard to start setting up our lab environment.
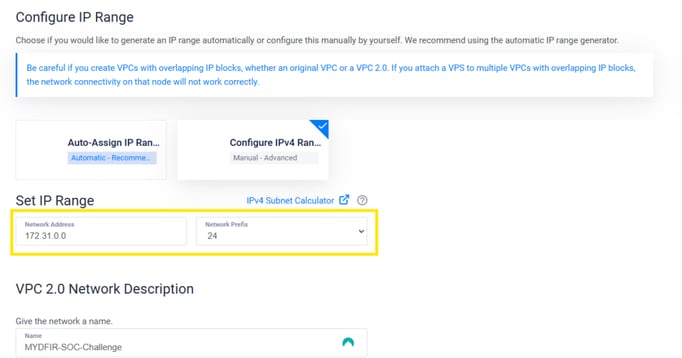
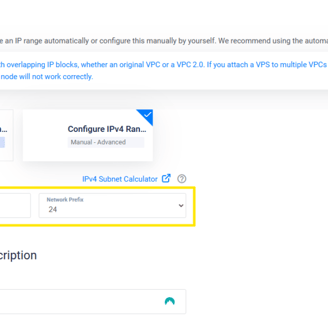
Next, we set up our Virtual Private Cloud (VPC), adding the IP range established in the diagram we created on Day 1.
Once we click "Create," our VPC v2 is successfully set up.
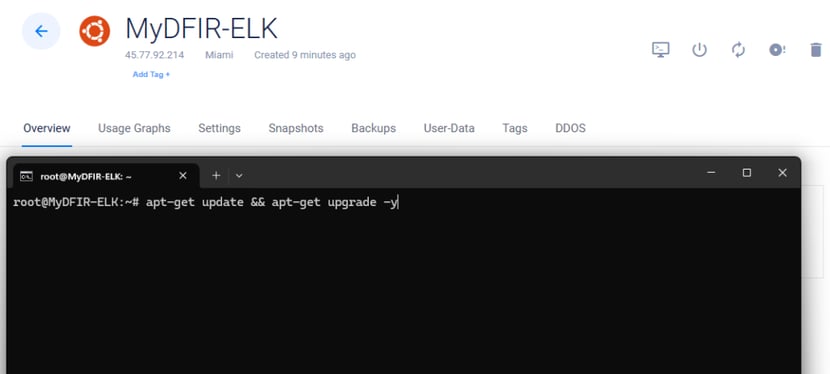
Once that’s done, we’ll SSH into the machine.
The first task is to update and upgrade the Ubuntu system to ensure it’s running the latest software and security patches.
Now lets install Elasticsearch.

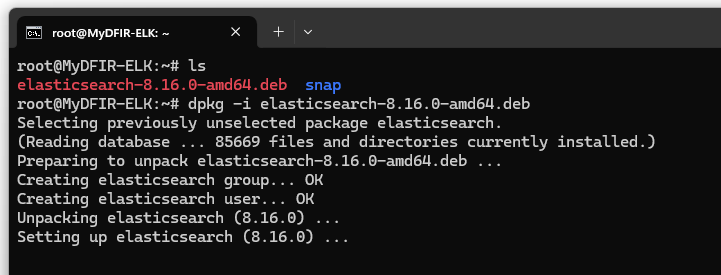
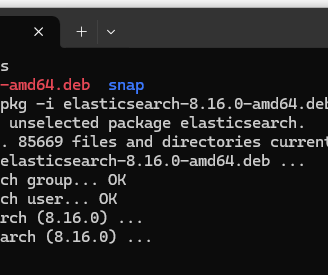
After downloading Elasticsearch, we’ll proceed to install it by running the appropriate command. This will unpack and set up Elasticsearch on the system.
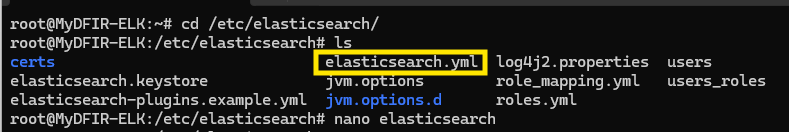
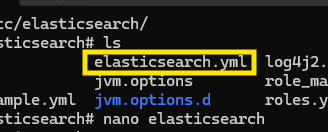
Next, we navigate to /etc/elasticsearch, the directory where Elasticsearch is installed. Here, we’ll locate the elasticsearch.yml file. This file contains all the configuration settings for Elasticsearch, which we’ll edit as needed.
In the elasticsearch.yml file, we’ll modify the network.host section by adding our public IP. This change allows our external SOC machine to connect to the server via SSH.
After making this change, it’s crucial to secure the VM by enabling and configuring firewall rules. To do this:
In this group, create a rule that allows SSH connections only from "My IP," ensuring that access is restricted and secure.
Go to the VM Details section in the VULTR dashboard.
Navigate to Settings and then to Firewall.
Select Manage Firewall and create a new firewall group—I named it MyDFIR-challenge.
Next, go to the VM Details section, then Settings and Firewall. Select the firewall group you just created (e.g., MyDFIR-challenge). After that, click on the Update button to apply the rule.
This will ensure that only your specified IP can access the VM via SSH, helping to secure it from unauthorized access.
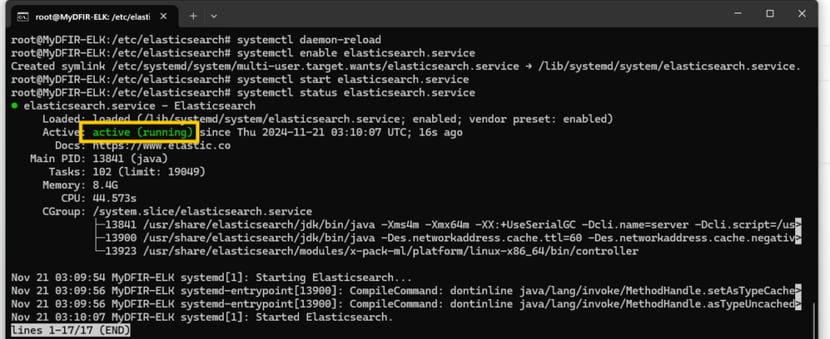
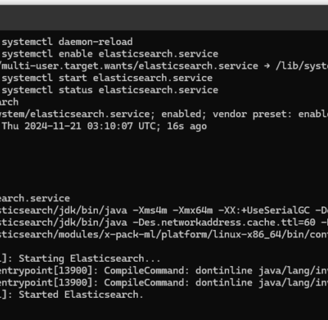
Now we’ve successfully installed Elasticsearch, and it’s running on our Ubuntu VM. Pretty cool! Now that we have it up and running, we can start configuring and using it for the rest of the lab. Tomorrow, we tackle Day 4!
DAY 4
Today’s task is: install Kibana.
I’ll keep it short this time because DAY 3 ended up being pretty long, and if every day is like that, this blog will turn into infinite scrolling jaja.
Steps to Install Kibana:
Download Kibana: Go to the official website and download it, just like we did with Elasticsearch.
SSH into your server: Use wget to fetch the Kibana package directly on your server.
Edit the configurations: Open kibana.yml and make a few necessary adjustments.
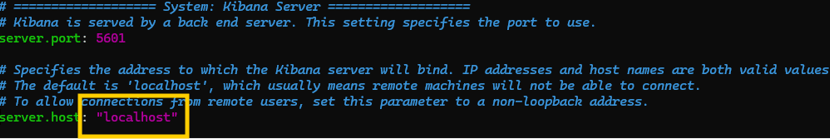
It's pretty similar to the Elasticsearch installation actually. We need to modify the server.port and server.host settings, and add the public IP of our VULTR server.
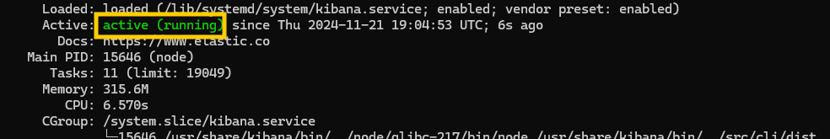
Again, pretty similar to Elasticsearch. We start the service and check the status, and it’s running—so pretty cool!
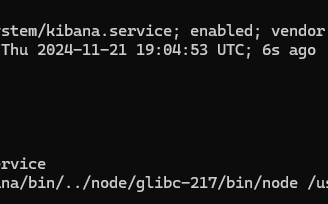
We need to generate a key to connect Kibana with our Elasticsearch server. This key will ensure that the two services can communicate securely.
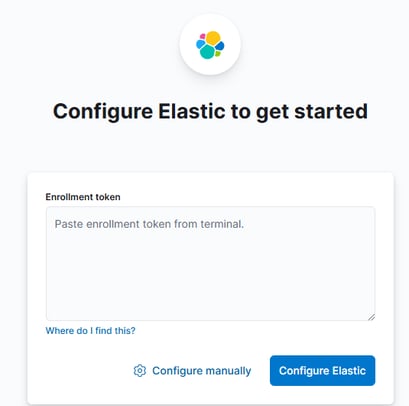
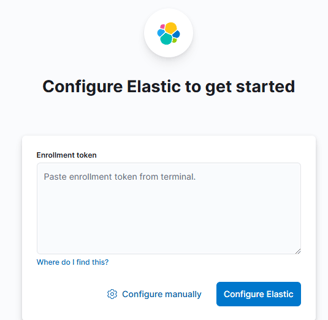
To generate the enrollment token code, we follow the process and copy it to paste into Kibana. However, there's an issue when trying to access the Kibana web GUI: we're using port 5601 for Kibana, but the firewall only allows port 22 for SSH.
To resolve this, we need to create a new firewall rule that allows TCP connections on port 5601 (for Kibana) and restricts access to our IP. We also select the entire range of ports to avoid any future connectivity issues. This will ensure we can access the web interface without any problems.
With this new firewall rule in place, it should allow us to connect to the Kibana web GUI on port 5601. By restricting access to our IP and opening the necessary port, we ensure secure and uninterrupted access to the interface.
After adding our enrollment token code, Kibana sends a verification code to our server. To retrieve it, we need to move to /bin/kibana-verification-code.bat to get the code.
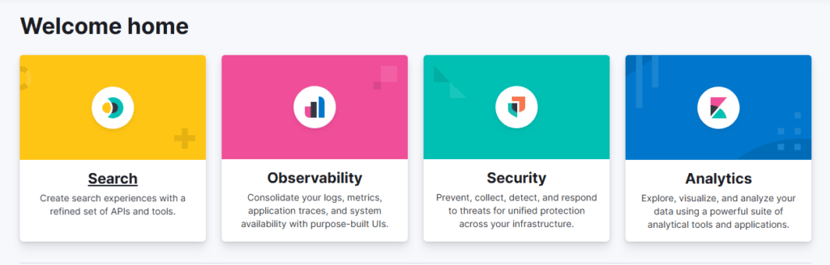
Once we have the code, we enter it into the Kibana verification screen. Then, Kibana prompts us for a Username and Password. These credentials are part of the "Security autoconfiguration information" that was generated on Day 3 and saved into a notepad. After entering the credentials, we’re successfully logged in!
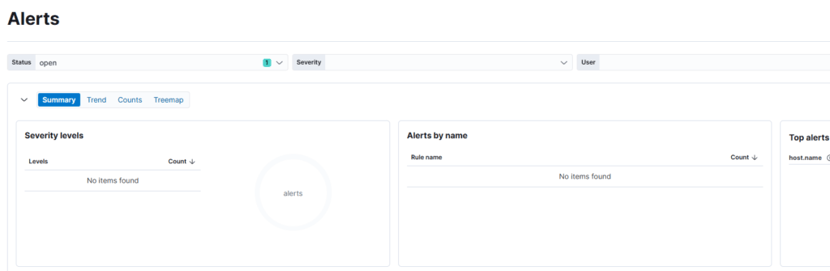
We’re going to move to Security - Alerts in the left menu, but to access the Alerts tab, Kibana asks us for a key that we don’t have yet. To gain access to this tab, we need to perform a few more configurations. Let’s go ahead and complete those steps to unlock this feature.
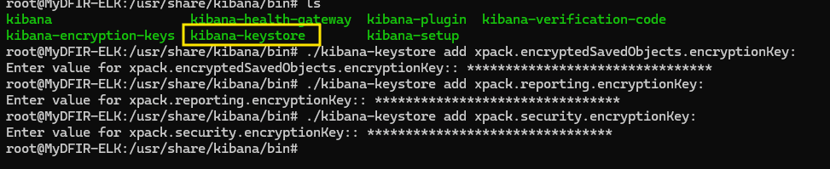
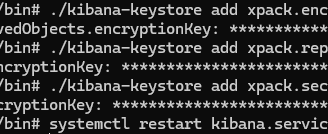
Inside the /usr/share/kibana/bin directory, we can run the kibana-encryption-keys file to generate the necessary keys. These keys will be stored in a key store, which is located inside the same folder. This will allow us to access the Security - Alerts tab and complete the configuration.
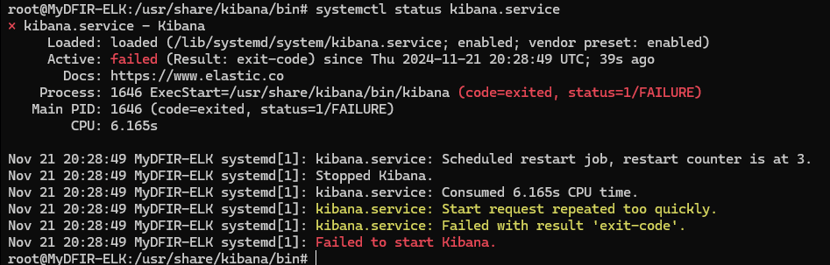
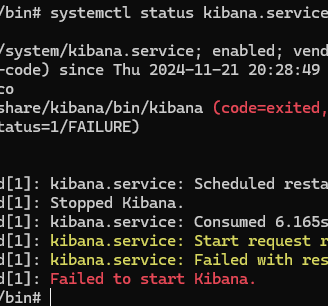
After running the necessary commands to generate the keys and store them in the key store, we restart the Kibana service. At this point, we should have access to the Alerts tab in Kibana.
However, it looks like something went wrong, and now Kibana isn’t starting. 😅
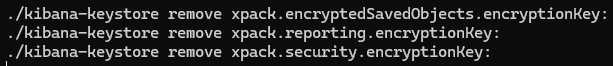
To troubleshoot, let’s start by undoing the last change, which was related to the keystore. Since you added keys using the ./kibana-keys command, we can remove any keys that were added and then attempt to restart Kibana.
It worked again, so I’ll try adding the keys once more and see if the problem happens again.
While adding the keys, I realized my mistake: I copied the segment "xpack.encryptedSavedObjects.encryptionKey:" including the colon. When the command ran, it looked like this: "/kibana-keystore add xpack.encryptedSavedObjects.encryptionKey::"
What I actually needed to do was copy just the text without the colon.
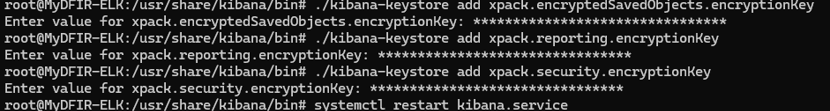
Cool, it worked! Thankfully, it was an easy fix, and now I have access to the Alerts tab.
Cool here ends DAY 4, I wont extend these more! jajaja
DAY 5
Today it's Windows Server time! Let's do this!
We select Deploy and then click "Deploy New Server" on the blue button at the top right. We choose the location (I picked Miami for the ELK server, so I chose Miami for this one as well).
At this point, Steven made some changes to the diagram, and now both Windows and Ubuntu servers will be outside the VPC, just for security reasons. This ensures that no one can access my servers directly if they can't access the Elastic server.
The thing is, this server will be a "Victim Server" that anyone can access. So, with important servers and ones open to everyone, things could get messy if not handled carefully.
Everything was pretty straightforward—no VPC, no firewall, just the cheapest option, and that's it.
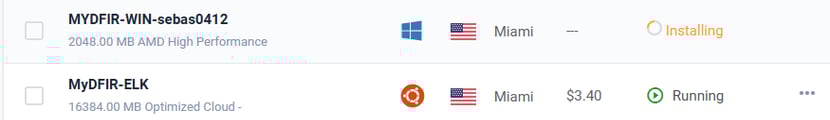

There it is, my server is installing.
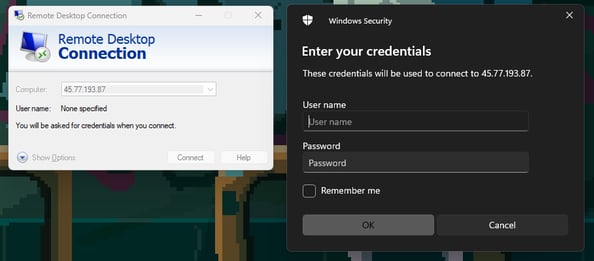
Once installed, you can try connecting with Remote Desktop. If it lets you in, your server is ready and open to the internet.
Today was a short day, but now we have 2 machines running! Tomorrow, we’ll set up the Fleet Server!
DAY 6
Today, we’ll learn about the Fleet Server. This will allow us to install agents on multiple machines at once and configure logs, avoiding the need to set up each machine individually.
For an enterprise environment with hundreds of systems, this is incredibly useful for managing all Elastic Agents.
Elastic Agent:
This tool enables us to monitor logs, metrics, etc., in a unified way. The agents work based on policies we can create, add, and modify. These policies specify which logs to forward to our Elastic server. The agent can be installed in two ways:
Standalone (only the agent)
Fleet Managed (we’ll use this option)
Fleet Server:
The Fleet Server is a component that collects agents into a fleet, allowing us to manage them in a unified way. It makes it easy to update and modify the agents.
And that’s it for Day 6! Tomorrow, we’ll put everything we learned into practice by building a Fleet Server and installing an agent.
DAY 7
Today, we’ll build a Fleet Server and start managing and installing Elastic Agents. Let’s do this!
As usual, I started by selecting Deploy and clicking "Deploy New Server" on the blue button at the top right. I chose the Miami location (just like the ELK server).
I won’t show how I installed the VMs because it’s the same process as the ELK and Windows machines, and there are many more days ahead. I want to keep this post as short as possible.
This server will be inside the VPC, so we select our VPC and deploy it.
While our VM is installing, we need to go to our Web GUI and navigate to: Management - Fleet.
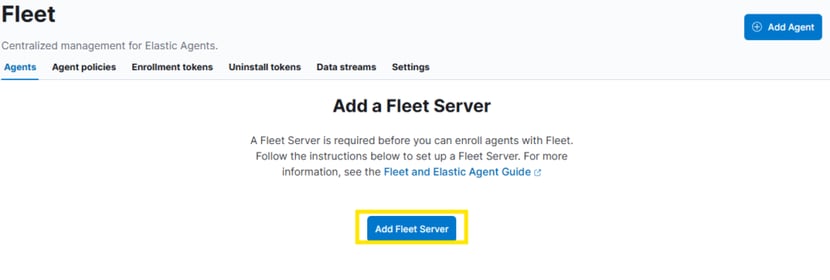
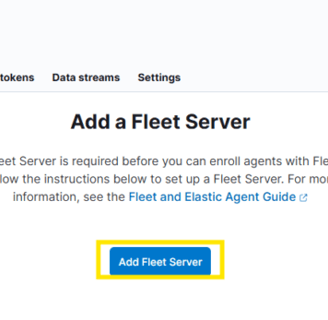
Click on Add Fleet Server.
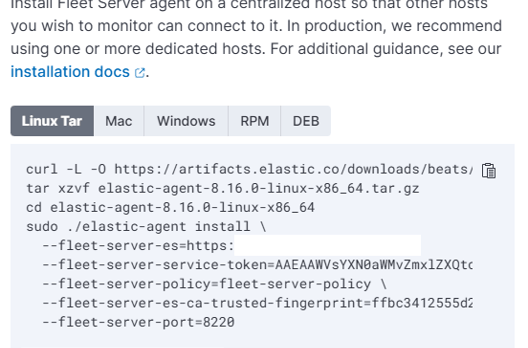
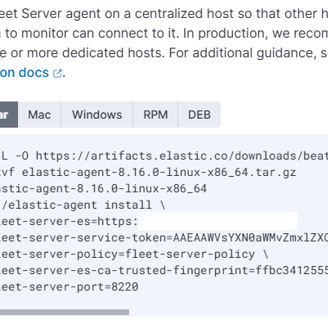
Next, add a name and URL, then click on "Generate Fleet Server Policy". Once the policy is created, you’ll receive an installation command that we need to run on the Fleet Server VM.
So, we SSH into the server and run update | upgrade. While that’s happening, we can go to our firewall and enable the Fleet Server IP address, since we currently only have our personal IP address allowed.
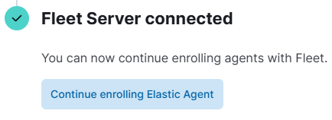
Once that’s done, we paste the curl command, and that’s it—our Fleet Server is connected!
So, we SSH into the server and run update | upgrade. While that’s happening, we can go to our firewall and enable the Fleet Server IP address, since we currently only have our personal IP address allowed.
Once that’s done, we paste the curl command, and that’s it—our Fleet Server is connected!
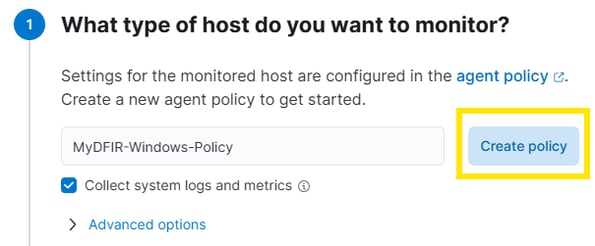
This will generate a command for us to add the agent to Windows, as this agent will be installed on our Windows machine. It's similar to the one we used to install the Fleet Agent.
Next, we move to our Windows Server VM, open PowerShell, and paste the command.
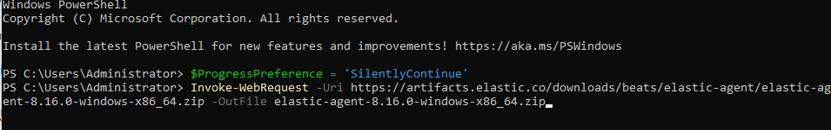
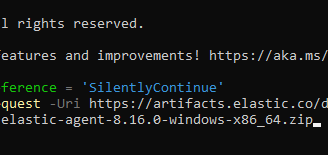
Once it ask you if you want to install the Service, yo select Yes and it will installed.
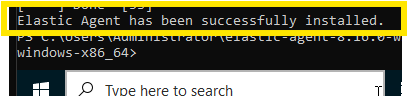
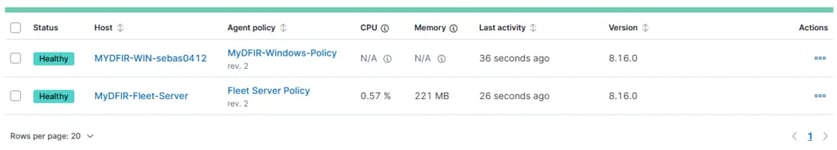
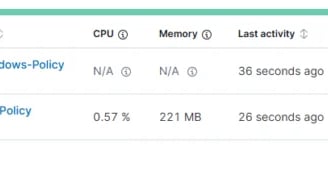
Now, we go to Elastic and check for agents in the Fleet tab, and there it is!
DAY 8
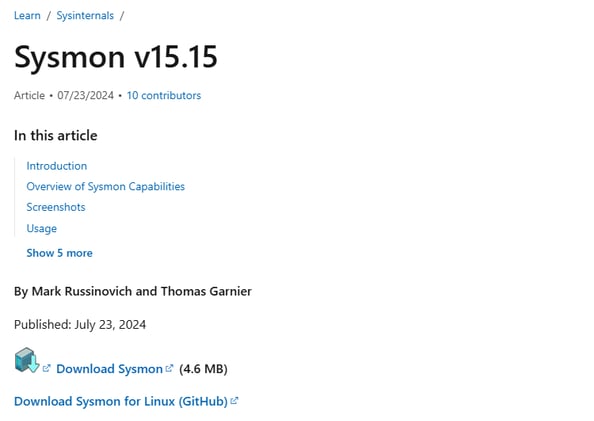
Today, we will understand what Sysmon is.
Sysmon is a free tool from Microsoft that monitors and logs system activity in Windows. It provides detailed information related to various events, such as:
Process Creation
Network Connections
File Creation
etc.
Sysmon generates Event IDs to help us understand the type of events occurring on our systems.
Sysmon Main Page
And that’s it for today. Tomorrow, we will install Sysmon!
DAY 9
Today, we will apply everything we learned on Day 8 and install Sysmon on our Windows server! Let’s do it!
First, we’ll connect to our server via Remote
In Edge, we search for Sysmon in the browser, and then click on Download Sysmon.
Once downloaded, we need to extract the ZIP file. I created a folder on the Desktop and extracted it there.
Now, the next step is to download the Sysmon configuration file. We search for the OlafHartong repository for Sysmon-modular. We find the systemconfig.xml file, download the raw format, and add it to the Sysmon folder.
Once that’s done, we can open PowerShell and install Sysmon by selecting the config file we downloaded. And that’s it—Sysmon is installed!
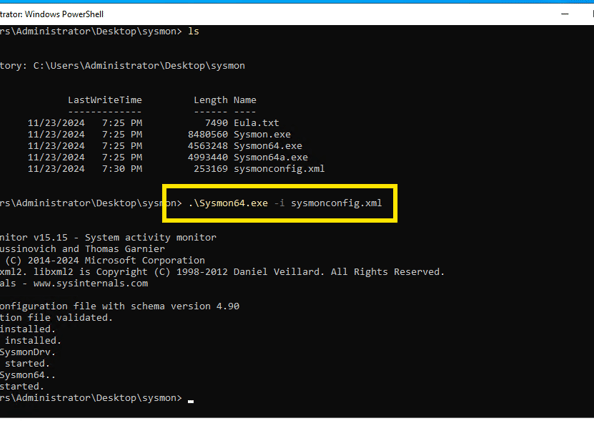
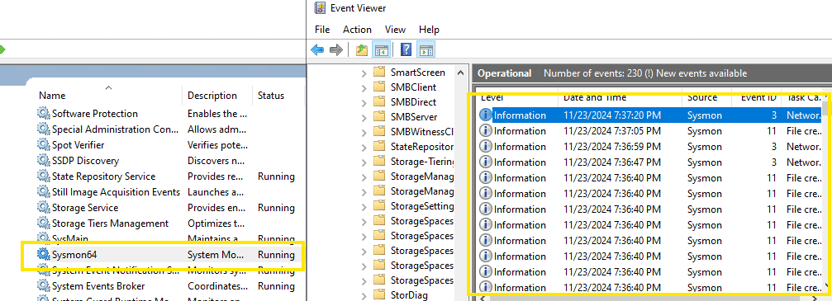
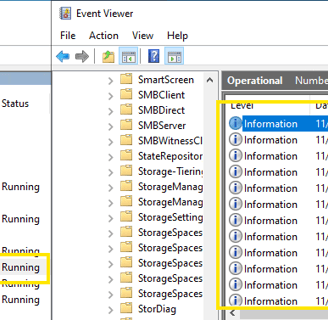
Now, we can see Sysmon running in our Services, and in the Event Viewer, we can observe various events logged by Sysmon!
And that’s it for today. We are now generating more detailed and advanced events that we can redirect to our Elastic and Kibana server for data analysis.
DAY 10
Today we will ingest all sysmon logs that we create yesterday.
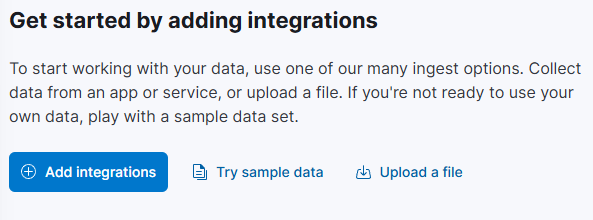
Lets add an integration.
Then, search for Windows Event Logs and click on "Add Custom Windows Event Logs".
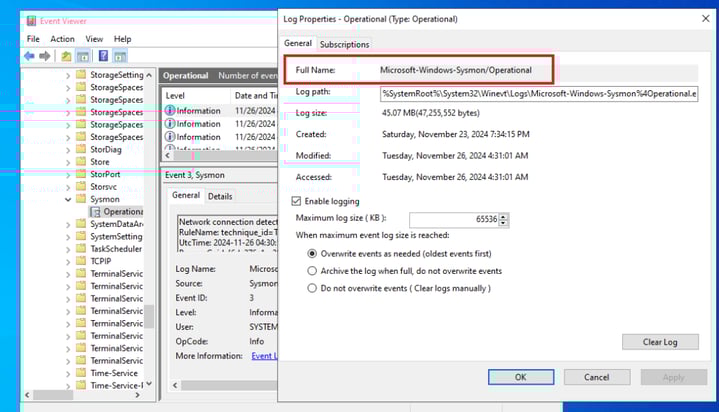
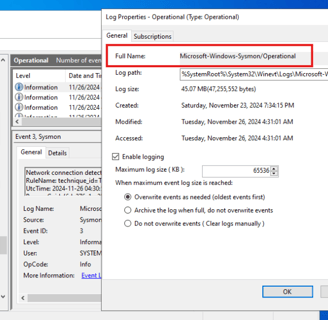
When adding the integration, it will ask for a Channel Name. To get this, go to your Windows machine, navigate to Event Viewer > Applications and Services Logs > Microsoft > Sysmon, right-click on Properties, and copy the full name.
Once that is copied and pasted, select Save and Continue, then Deploy Changes.
Now, we need to do exactly the same for the Windows Defender logs.
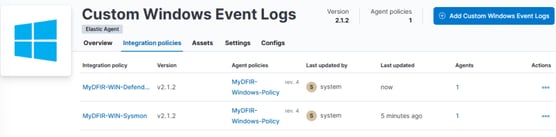
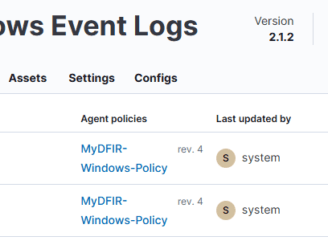
And there it is—two policies: one for Sysmon and the other for Windows Defender.
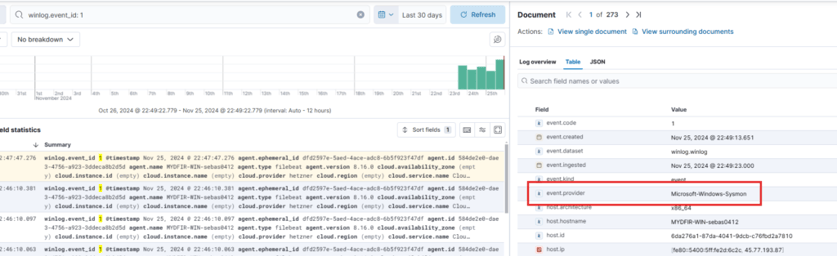
After making a few tweaks in the video, we can now see that the event provider for this log is Microsoft Sysmon!
and thats it for Day 10! see you tomorrow (Literally a row down jaja)
DAY 11
Today, let's learn about brute force attacks and tools to defend against them!
Brute Force Attack: It's a hacking technique where an attacker systematically tries every possible password combination to find the correct one.
There are 3 important forms of this attack:
Simple Brute Force: Trying every possible combination (trial and error).
Dictionary Attack: Similar to Simple Brute Force, but uses a list of common words and phrases often used in passwords (higher chance of success).
Credential Stuffing: This attack takes advantage of reused credentials. The attacker uses credential dumps and tries every possible combination of usernames and passwords.
Ways to protect against brute force attacks:
Use long and complex passwords that include uppercase letters, symbols, and numbers.
Multi-factor Authentication (MFA): This method uses two types of authentication methods: something you have, something you know, and something you are.
And that's it! Now we understand what a brute force attack is and how to protect against it.
DAY 12
Today, we will set up an SSH server to view authentication logs.
Let's start by deploying a new Ubuntu machine on VULTR, just like the others.
Next, let's cd to /var/log/auth.log. In this file, we'll see all the failed login attempts to our machine.
Using grep, we can filter the logs to only see the ones we're interested in. I’ll wait a bit to check if any interesting logs are generated!
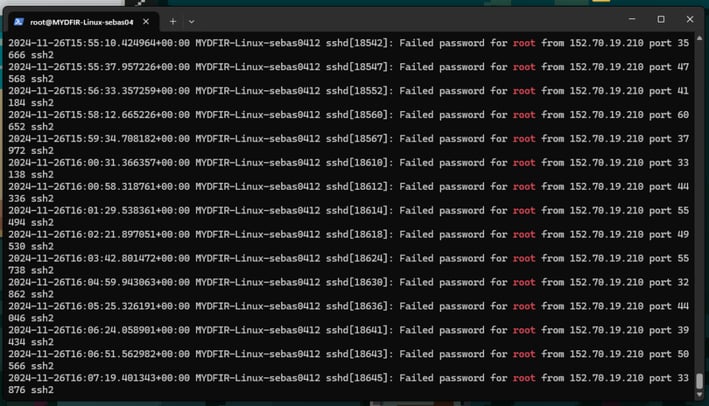
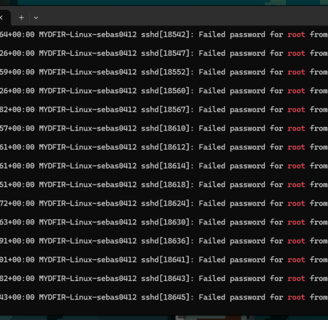
These are all the attempts overnight! It's crazy how many alerts were generated! But for now, that's it for the day. Tomorrow we will install the Elastic Agent on the SSH Server.
DAY 13
Today, we will set up the Elastic Agent on the SSH server.
We need to start from the Web GUI and go to Fleet to create a new Agent Policy. Here is my new policy.
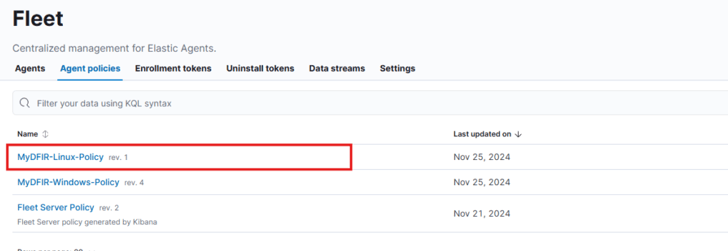
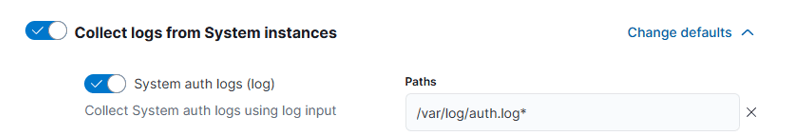
Now we go into the policy - system 3, and we can see that our policy is actually collecting logs from where we want, which is /var/log/auth.log.
Now we will create the new agent, I actually show how to do this in past Days and there is the video, so for saving space in the Blog I wont add screenshots on this.
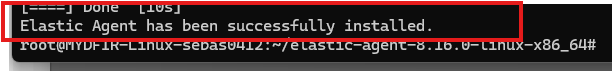
Now it's installed on our SSH server. Once it's installed, we can see our SSH server logs directly from the Elastic web GUI. It's pretty cool how we’re gathering logs from different machines and processing them all in one place!
Tomorrow, we’ll create alerts for brute force attacks!
DAY 14
Today we will create a SSH Brute Force Alert and Dashboard. First lets see how a brute force looks like inside Elastic.
These are all Brute force Attacks, and here its when things get interesting, we are only filtering for our SSH server, And we can see a lot of Login attemps
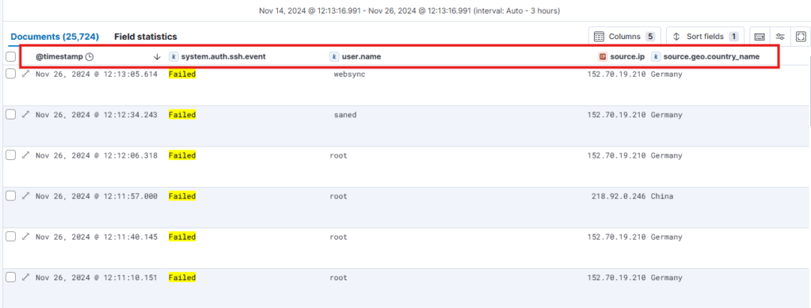
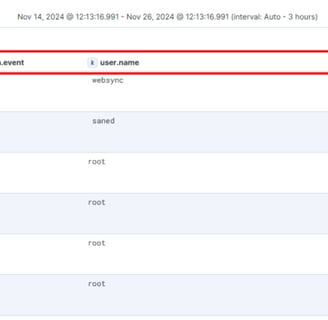
Watching All this attempts to login its crazy just on one night.
We can save this search to keep using it when we want to search for ssh login attemps on the right corner we hit "Save"
And now we can create a rule like this one:
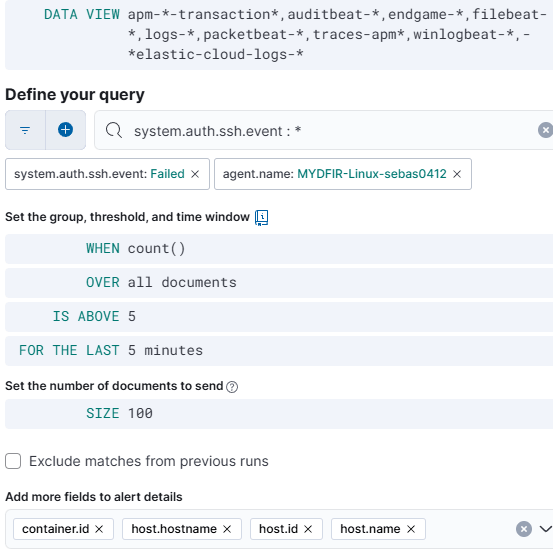
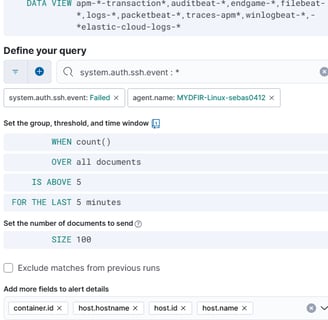
This part is pretty basic, but it’s a great way to get some hands-on experience with rule creation.
We now have a dashboard showing Failed and Accepted Authentications over the last 15 minutes.
It’s all coming together, and I’m excited to see what we can accomplish next!
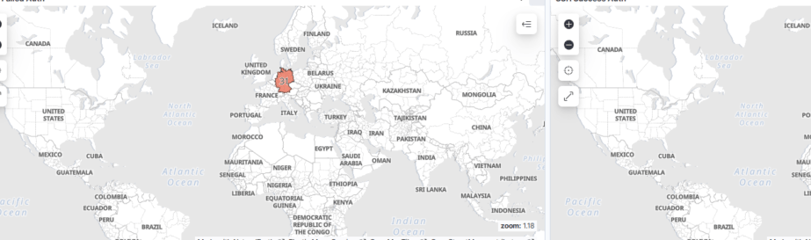
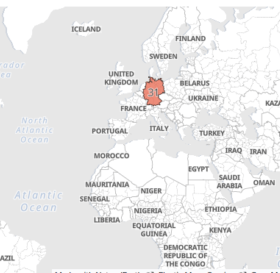
This day has quickly become one of my favorites! We’ve started analyzing the login attempts we’ve been collecting and discovered where they’re coming from. Seeing this data come to life in dashboards has been incredibly rewarding.
DAY 15
What is RDP?
Remote Desktop Protocol (RDP) is a protocol used for communication and remote control of a PC from anywhere, as long as you have the credentials. Key details include:
Risks: RDP is one of the most abused services by cybercriminals, making it crucial to secure.
Encryption: RDP communications are encrypted and encapsulated within TCP.
Port: The default port is 3389.
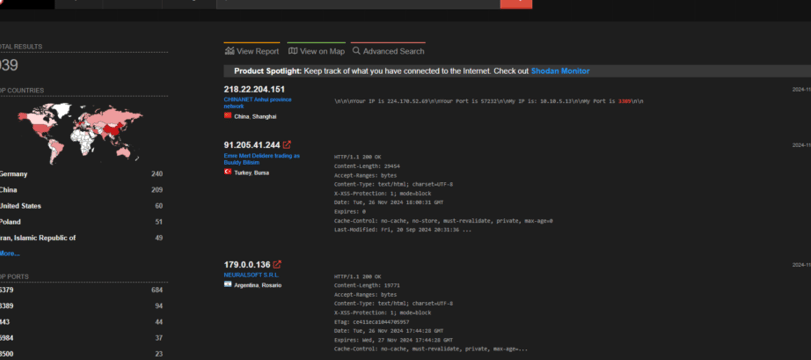
Shodan:
Using Shodan, we just need to filter for port 3389 to see machines with this port open. This is a great way to identify exposed servers and assess potential vulnerabilities.
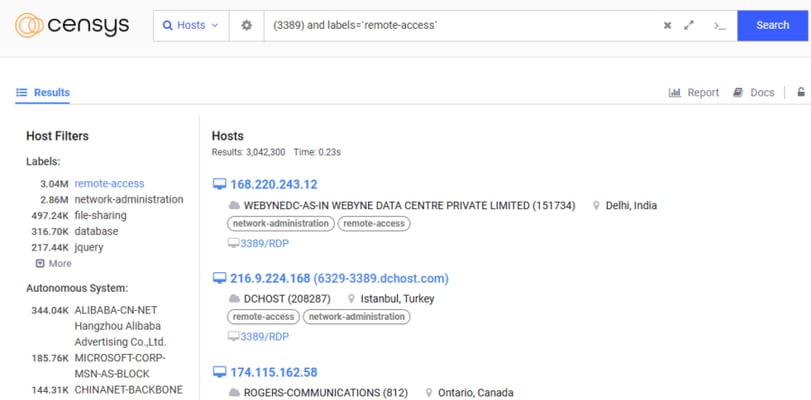
Cencys:
Like Shodan, Censys is a powerful tool for finding exposed services on the internet. If you're looking to identify systems with RDP enabled, here's how you can use it effectively:
Search for Port 3389:
Port 3389 is the default port for Remote Desktop Protocol (RDP). Start your search by filtering for this specific port.
Refine Your Search:
To narrow down results, add filters for Remote Access services. This helps you focus on systems explicitly offering RDP or similar access tools.
Using Censys for this type of reconnaissance allows you to evaluate exposure and understand how attackers might target vulnerable systems. Always remember to use such tools ethically and within the bounds of your organization’s policies!
How to Protect Against RDP Abuse: Practical Tips
Remote Desktop Protocol (RDP) can be a powerful tool, but if left unsecured, it becomes a common entry point for attackers. Here’s how you can strengthen your defenses:
Turn off RDP when not in use: This reduces exposure to potential attacks.
Use Multi-Factor Authentication (MFA): Protect against brute force attempts with an added layer of security.
Restrict Access: Use a firewall to limit access to only those who need it.
Set Strong Passwords: Include uppercase letters, numbers, and symbols to make guessing more difficult.
Disable Default Local Accounts: Minimize attack surfaces by removing unnecessary accounts.
Halfway Through the Challenge! 🚀
I'm thrilled to share progress on this project. We've successfully collected and visualized data through dashboards, learning a ton along the way about:
Cloud deployments
Elastic Stack
SIEM tools
Windows and Linux log collection
This journey has been an incredible learning experience, and I’m eager to tackle the second half. My hands-on skills have grown immensely, and I’m documenting every step here to align with the purpose of this blog: sharing and learning through experience.